
Assessing Fatality Rates in Crash Involvement for Motorists and Non-Motorists in Teen Driver Crashes by Risk Factor
This research brief presents findings from the 2016 FARS and CRSS database assessing the rate of fatalities for different individuals, and different risk factors involved in a teen driver crash
October 2018
Suggested Citation
Abstract
From 2007 to 2016, fatalities of young drivers (15-20 years old) have declined by nearly 40% (NCSA, 2018). Despite this large reduction, overall, young drivers are still overrepresented in motor vehicle crashes and their crashes continue to have an impact on other individuals. A previous AAA Foundation for Traffic Safety report examined the proportion of other people who died in crashes in 2013 involving a teen driver (ages 15 to 19) including passengers, occupants of other vehicles and nonmotorists (i.e., pedestrians and cyclists) (Tefft, 2015). That study’s findings revealed that teen drivers accounted for 34% of all fatalities related to teen crashes, while passengers accounted for 27%, occupants of other vehicles 29%, and nonmotorists 10%. This underscores the important impact that these crashes have on individuals other than the teen drivers themselves.
The present study uses 2016 data to update and expand on these findings by assessing the rate of fatalities for different individuals involved in a teen driver crash. Nonmotorists including pedestrians and cyclists showed a higher likelihood of dying when involved in a teen crash, with nearly 4 deaths per 100 nonmotorists. When grouping the rates of fatality by various risk factors, speeding resulted in about 35 deaths per 10,000 individuals involved in a teen driver crash, while nighttime driving resulted in 32 deaths per 10,000 individuals. Furthermore, nearly 3 in 10 nonmotorists involved in a speeding-related teen driver crash died in 2016 and nearly 1 in 10 nonmotorists died in a teen driver-related crash that occurred at night.
Key Findings
- Teen drivers were involved in roughly 1,053,000 crashes, resulting in 3,270 deaths, yielding an overall fatality rate of 11.4 fatal injuries per 10,000 individuals involved.
- Speeding and Nighttime driving were identified as major fatal risk factors among crashes with teen drivers.
- Crashes involving speeding teen drivers resulted in 35 deaths per 10,000 individuals involved.
- Crashes at night involving teen drivers has a fatality rate of 32 deaths per 10,000 individuals involved.
- Fatality rate for people involved in a crash with a teen driver carrying only teen passengers increased by 51 percent compared to crashes in which the teen driver is driving alone.
- Roughly two other road users die for every one teen driver fatality in teen-driving related crashes.
Methods
Data
Data used in this brief came from the 2016 National Highway Traffic Safety Administration (NHTSA), Fatality Analysis Reporting System (FARS), and the Crash Report Sampling System (CRSS) to analyze crashes in 2016 involving drivers aged 16 to 19 in passenger vehicles (i.e., cars, trucks, vans, minivans and SUVs).
Fatality rates were calculated to explore differences across types of individuals involved in the crashes as well as the impact of different risk factors. Fatality rates were calculated according to the following equation:
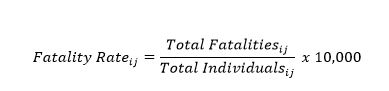
where i represents the type of individual involved in the crash (i.e., all individuals, teen driver, passenger(s) of the teen driver, occupants of other vehicles and nonmotorists including pedestrians and cyclists) and j represents the specific type of crash, described below. It follows that the total number of fatalities and the total number of individuals involved varied by i and j.
Certain risk factors, such as the age of the driver (16-17 vs 18-19), carrying only teen passengers, speeding, nighttime driving and driving during the summer months were analyzed. For these analyses, the number of fatalities and the fatality rate for teen driver crashes where these factors were present or absent were determined. In determining the fatality rates, the impact of such factors on fatalities in teen driver crashes is assessed.
Results
Overall fatality and fatality rates in teen driver crashes
In 2016, teen drivers were involved in an estimated 1,053,000 crashes involving nearly 2,864,000 individuals. In these crashes, there were 3,270 fatalities (Table 1). Of the 3,270 fatalities, 35.7% (1,169) were teen drivers, 22.6% (739) were passengers of teen drivers, 29.6% (969) were occupants of other vehicles and 11.6% (379) were nonmotorists (i.e., pedestrians and cyclists). The fatality rates also varied based on the type of individual involved in the crash.

Risk factors affecting fatality rates in teen driver crashes
A number of risk factors were also examined in the context of fatal teen-related crashes:
- Where the teen driver was driving in a vehicle with all teen passengers, driving with an adult, or driving by themselves.
- Involving young teen drivers (ages 16-17) versus older teen drivers (18-19).
- Involving speeding.
- Occurring at nighttime (9 p.m.-5 a.m.) versus daytime (5 a.m.-9 p.m.).
- Occurring during the summer (June- August) versus the rest of the year.
Three major risk factors that increase the fatality rates in a crash include nighttime driving, speeding, and carrying a passenger.
The presence of teen passengers in teen drivers’ vehicles was associated with an increase in the fatality rate for people involved in a crash. Carrying only teen passengers in a teen driver’s vehicle increased the risk of dying in a crash not only for the occupants of the teen driver’s vehicle but also for other people who share the road with them, compared to crashes where the teen driver is driving alone. Interestingly, when the teen driver is carrying at least one passenger age 35 and over, the overall fatality rate for those involved in a crash decreased by 8% compared to crashes in which teen drivers were driving by themselves.
Seasonal factors (or time of year) also influenced the observed fatality rates.
See brief for full findings and tables.
Suggested Citation