
Frailty, Physical Function and Driving Status in Older Adults: LongROAD Analysis of the National Health and Aging Trends Study
The purpose of the study was to examine the associations between physical frailty, physical functioning, and the rate of being a current-non-driver.
August 2017
Suggested Citation
For media inquiries, contact:
Tamra Johnson
202-942-2079
TRJohnson@national.aaa.com
Abstract
Driving is an integral component of the lives of senior drivers. Maintaining active driving is important to the health and well-being of older adults as driving cessation is associated with poor physical, social and mental health outcomes. Research has shown that several health-related factors are associated with driving cessation senior drivers. The purpose of the study was to examine the associations between physical frailty, physical functioning and the rate of being a current-non-driver.
The present study uses data from the National Health and Aging Trends Study (NHATS) to evaluate whether physical frailty and physical functioning are associated with becoming or being a current non-driver. Being frail and having poor physical functioning were associated with an increased rate of becoming or being a current non-driver. The measures used to evaluate frailty and physical functioning (Fried’s physical frailty phenotype and the Short Physical Performance Battery [SPPB]) may be useful screening tools for helping to identify older adults who may be at risk of becoming a non-driver. Identifying older adults as frail or as having poor physical functioning and being proactive with this information by recommending appropriate physical activities may help keep those at risk of becoming a non-driver on the road longer.
Methods
The NHATS cohort is a nationally representative sample of U.S. Medicare beneficiaries aged 65 years and older who reside in the community in their own or another’s home, or in a residential care setting outside of a nursing home (Montaquila et al., 2012). At baseline, 8,245 individuals participated (Kasper & Freedman, 2016). Data for this study were from NHATS across four years: 2011, 2012, 2013, and 2014. The study sample for each analysis consisted of individuals who had a lower extremity physical functioning score for at least one year of the study or had a frailty phenotype measure in 2011, and were current or previous drivers in 2011. The physical frailty analyses consisted of 6,288 participants with a complete frailty phenotype assessment at the start of the study. The physical functioning analyses consisted of 5,935 participants who had a Short Physical Performance Battery (SPPB) score for at least one year of the study.
Frailty in NHATS was assessed using the frailty phenotype by Fried (Fried et al., 2001). For this study, the frailty measure was based on information collected during the study’s first year. Poor performance by an individual on three or more categories indicated frailty. The five categories were: 1) weakness (grip strength); 2) slowness (walking speed); 3) exhaustion (a participant reporting having low energy or being easily exhausted); 4) low physical activity (not having recently walked for exercise or engaged in vigorous physical activity); and, 5) shrinking (unintentionally losing 10 pounds or more in the past year or being underweight according to the Body Mass Index (BMI)).
Physical functioning was measured each year of the study using the SPPB. The SPPB is used to measure lower extremity physical function and has three components: standing balance, walking speed, and repeated chair stands (rising from a chair and returning to a seated position). Each component is scored from zero (inability to carry out task) to four (best score), and then each score is summed to determine the overall SPPB score (0-12) (Guralnik et al., 1994). Total scores on the SPPB were categorized as poor (0-5), fair (6-9), and good (10-12) (Chen, Chang, & Lan, 2015; Guralnik et al., 2000).
For each year, respondents who reported driving at least rarely within the last year were classified as current drivers; respondents who reported never driving in the past year were classified as non-drivers. Variables that were previously associated with driving cessation among older adults were included as additional variables in the frailty phenotype and SPPB analyses, including gender, age, race/ethnicity, living arrangement, dementia, and a comorbidity scale of other health conditions (Ackerman et al., 2008; Anstey et al., 2006; Choi et al., 2013; Gwyther & Holland, 2012; Herrmann et al., 2006).
Statistical modeling, utilizing weighted analyses as appropriate, was used to evaluate both the association of frailty in 2011 with becoming a current non-driver over time and the association between SPPB total score measured at multiple time points with being a current non-driver (Hanley et al., 2003; Chen et al., 2014; Zou, 2004; Montaquila et al., 2012).
Results
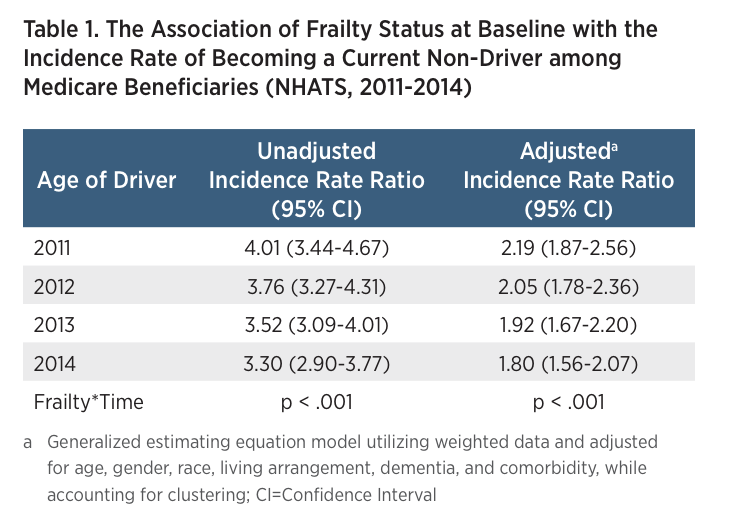
Frailty. The percentage of the cohort that was categorized as frail at the beginning of the study in 2011 was 15%. Almost 17% of the participants in the cohort were non-drivers in 2011, but had previously driven in their lifetime. Table 1 shows that in 2014, frail participants show a higher incidence rate of becoming a current non-driver, 3.30 times that of non-frail participants. After adjusting for other variables, the results were still statistically significant showing that frail participants had an incidence rate 1.80 times (an 80% increase) that of non-frail participants.
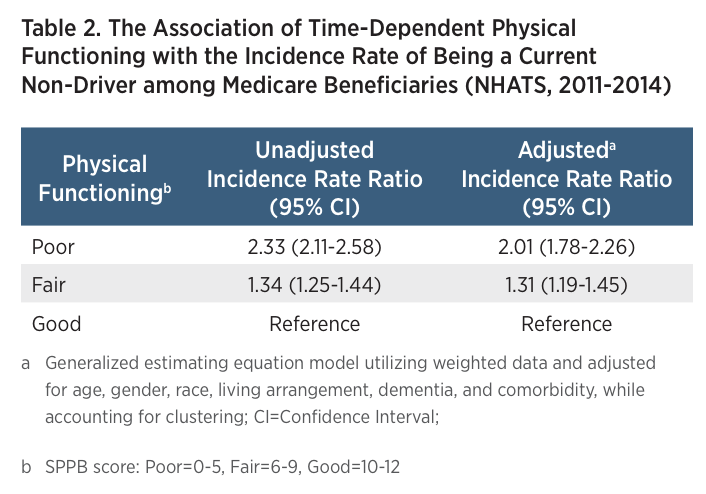
Physical Function. In 2011, almost 19% of older Medicare beneficiaries had a poor SPPB score, 28.5% had a fair SPPB score, and almost 53% had a good SPPB score. Table 2 shows that participants with a poor SPPB score had an incidence rate for being a current non-driver 2.01 times the rate (a 101% increase) of those with a good SPPB score. Additionally, participants with a fair SPPB score had an incidence rate for being a current non-driver 1.31 times the rate of those with a good SPPB score (a 31% increase).
Discussion
Although the outcome for this study was current driver status, versus definitive driving cessation, the analyses presented here found that both frailty and poor lower extremity physical functioning levels increased the incidence rate of becoming or being a current non-driver, respectively. Participants categorized as frail had an increased rate of becoming current non-drivers compared to participants categorized as non-frail, both before and after adjustment for other relevant variables. Regarding physical functioning, the analyses determined that participants with poor and fair total SPPB scores had an increased incidence rate for being current non-drivers than participants with good SPPB scores, again both before and after adjustment for other relevant variables. These results are consistent with those from smaller cohort studies that found poorer SPPB scores to be associated with decreased driving (Gill et al., 2012; Sims et al., 2007). It has been suggested that poorer SPPB scores can be considered a predisposing factor, making older adults vulnerable to decreased driving or cessation, and that intervening illnesses or injuries (e.g. falls, heart failure, stroke, etc.) are precipitants (Gill et al., 2012).
This study used four years of data from the nationally representative NHATS cohort. A strength of the study is the use of total SPPB score as a variable that could change over four years, which emphasizes the dynamic nature of lower extremity mobility. Some limitations of this study include the scope of the NHATS driving questions, which did not include a date for last time driven in any rounds other than the first round and did not question whether drivers ever planned on resuming driving if they had not driven in the previous year. We classified drivers as current non-drivers or current drivers at each round based on their responses to a question asking if they had driven at all in the past year. It is possible that some individuals who were no longer driving at the time of the survey were misclassified as current drivers, when in fact they may have driven at some point throughout the past year but were no longer driving at that moment.
Finally, due to the constraints of the way driving status was collected we were unable to directly assess the precise causes for becoming a non-driver in this study. The Longitudinal Research on Aging Drivers (LongROAD) Study funded by the AAA Foundation for Traffic Safety has a module devoted to driving cessation. Thus, the date of driving cessation can be collected and we will be able to move beyond descriptive analyses, to begin to address how frailty status and levels of SPPB relate to driving cessation.
Previous research has specifically indicated that physical activity interventions tailored to the needs of older adults can improve their physical functioning (Pahor et al., 2006). Intervening through an appropriate physical activity intervention when lower extremity physical function and frailty status indicate the need could have the complementary effect of helping to keep older adults safely on the road.
Suggested Citation
For media inquiries, contact:
Tamra Johnson
202-942-2079
TRJohnson@national.aaa.com