
Observed Maintenance, Damage, Technologies, and Adaptations among Vehicles of Older Drivers: A LongROAD Study
Using baseline data from the Longitudinal Research on Aging Drivers (LongROAD) study, this research brief describes general vehicle information, maintenance, damage, and presence of in-vehicle advanced technologies and aftermarket adaptations.
April 2018
Suggested Citation
For media inquiries, contact:
Tamra Johnson
202-942-2079
TRJohnson@national.aaa.com
Abstract
Through inspections of participants’ vehicles, the study found that among this cohort of older drivers, overall, vehicles were well maintained, had little damage, and contained a wide range of advanced technologies, but few aftermarket adaptations. However, vehicles of older drivers with the lowest household incomes were less well maintained and had more damage and fewer technologies than vehicles used by drivers with higher incomes. The objectively measured prevalence of technologies and aftermarket vehicle adaptations reported in this brief complement the self-reported technologies and adaptations reported in a previous brief (Eby et al., 2017).
Methods
LongROAD is a multisite longitudinal study of active drivers aged 65-79 at enrollment (see Li et al., 2017 for complete LongROAD study methods). Study data were collected through an inspection conducted on each participant’s primary vehicle at the baseline appointment. Table 1 summarizes the data collection categories, their elements, and method of measurement.
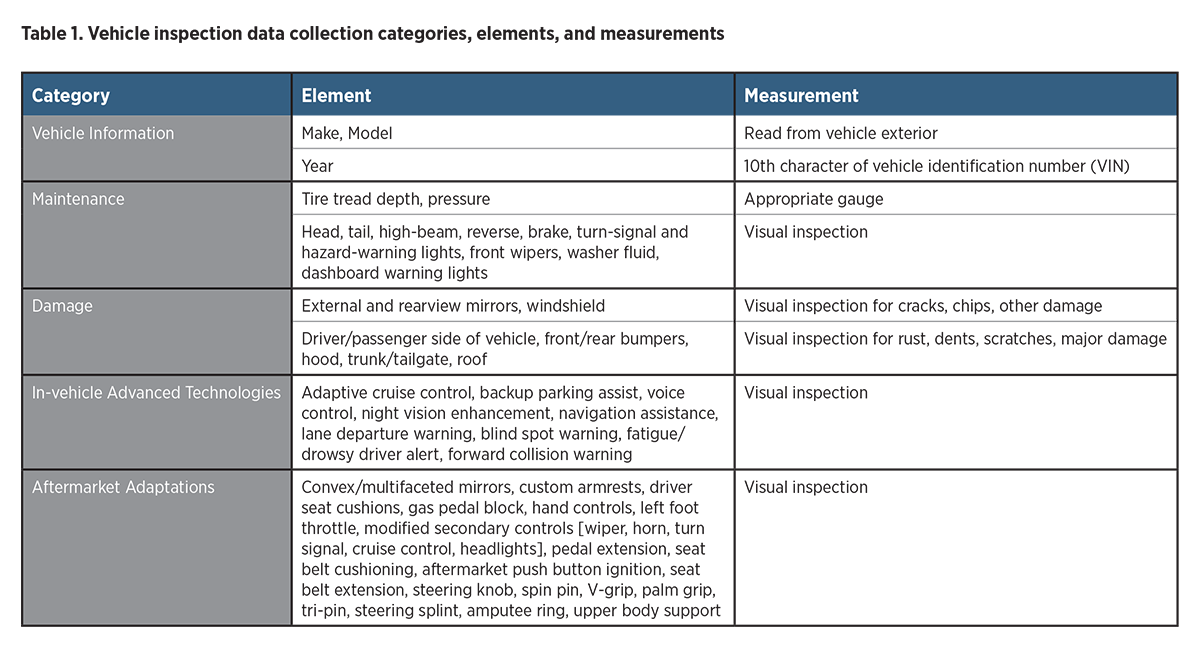
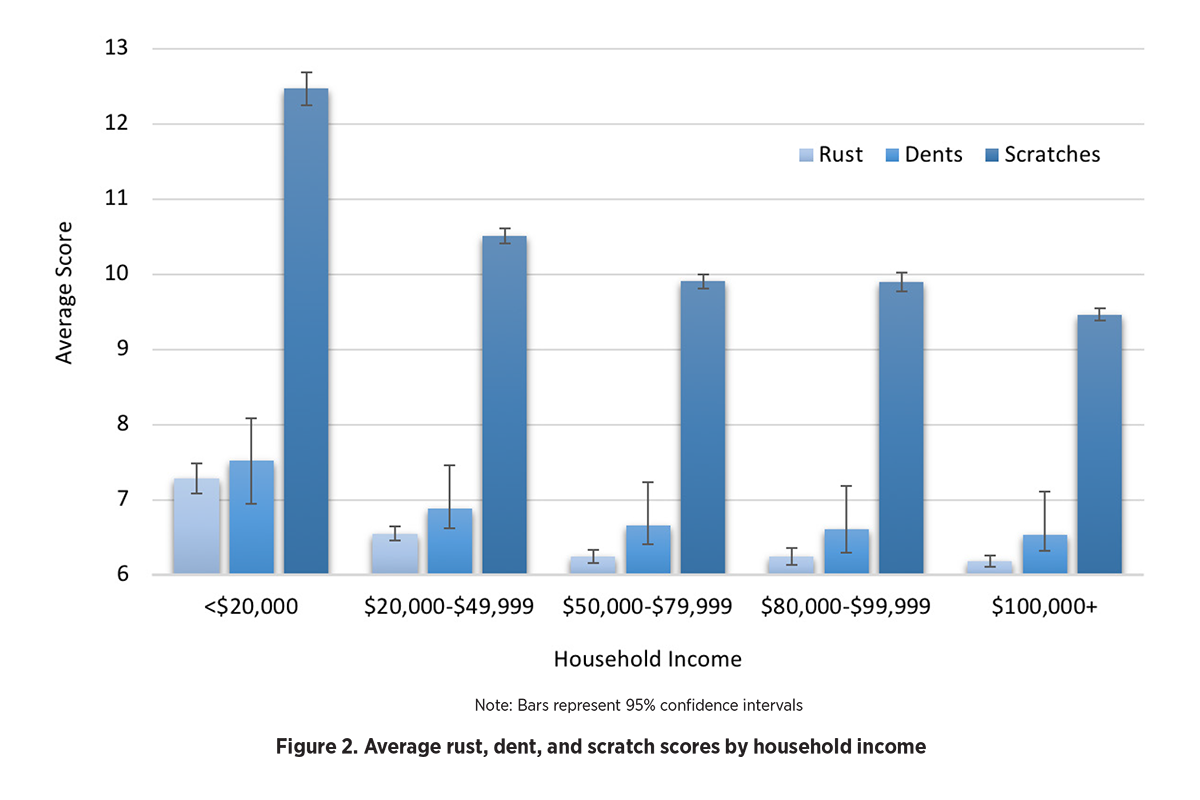
This study analyzed damage data collected from six regions of the exterior of the vehicle. Rust and scratches in each region were recorded using a four-point score (1=none; 2=minor; 3=moderate; and 4=severe). Dents were also recorded using a four-point score (1=none; 2=small; 3=medium; 4=large). Major damage was simply recorded as not present or present. For each element of the damage category, individual scores for overall rust, scratch, dent, and major damage were derived by adding the scores for each region. Scores for overall rust, scratches, and dents could range from 6-24, while the major damage scores could range from 6-12. This study excluded vehicles with missing damage data for analyses on that damage category.
Descriptive analyses were conducted to determine maintenance and the prevalence of damage to the vehicles, as well as the prevalence of advanced technologies and aftermarket adaptations. Further analyses were conducted to determine if these data were related to demographic characteristics (sex, age group, the interaction of sex and age group, and household income) using analysis of variance.
Results
Demographics
A total of 2,988 LongROAD participants’ vehicles were inspected at baseline between July 2015 and March 2017. Fifty-three percent of participants were women. The mean age of participants was 71.1 years (SD = 4.06, range = 65- 79), with 41.5% in the 65-69 age group, 34.7% in the 70-74 age group, and 23.8% in the 75-79 age group. Household incomes were skewed toward higher incomes: <$20,000 = 4.6%; $20,000 – $49,999 = 22.2%; $50,000 – $79,999 = 24.9%; $80,000 – $99,999 = 15.0%; and $100,000 or greater = 33.3%. Nearly 90% of participants identified as White/Caucasian.
Maintenance
Lights, Mirrors, Wipers and Warning Lights Nearly all vehicles had all lights working (i.e., emitting light) and mirrors present, with intact glass/lenses. Similarly, high levels of function were found for wipers (99.9%) and washer fluid (98.0%). Nearly all vehicles had windshields (89.9%) and windows (99.6%) free of cracks and chips. In addition, participants’ vehicles rarely had illuminated warning lights on the dashboard; the most prevalent warning light was the check engine light, activated in 4.3% of vehicles.
Tire Tread Tread depth was analyzed in two ways. First, we classified a vehicle as having poor tread depth if any of the four tires on the vehicle had a depth of 3/32 inch or less. Across the 2,988 vehicles for which we had complete data, 5.5% (n=164) had at least one tire with poor tread depth. Results showed no differences between sex, age group, or the interaction between sex and age group. However, those in the lowest income group were more likely to have at least one tire with poor tread compared with higher income groups.
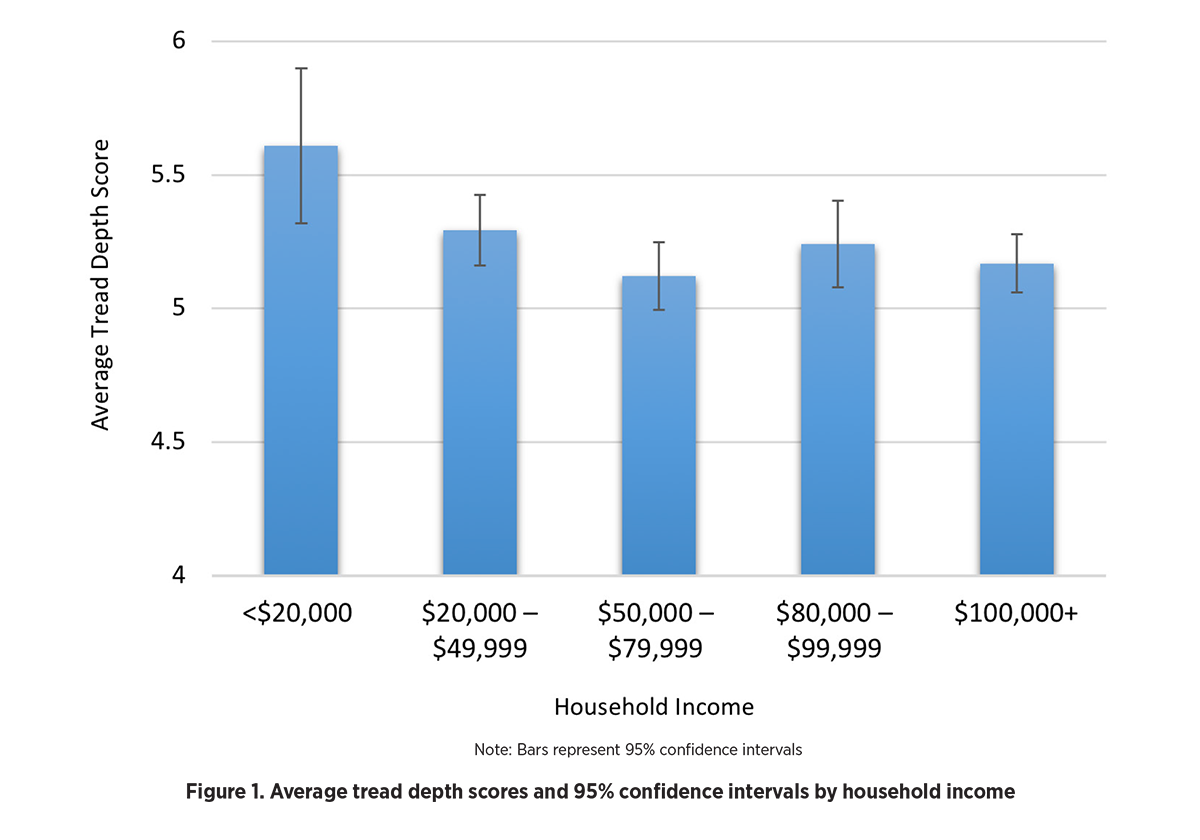
Tread depth was also assessed through analyses conducted on the computed overall tread score for each vehicle (ranging from 4-12, with low numbers indicating greater tread depth). Results showed that 59.3% of vehicles had a score of 4; that is, good tread depth on all tires. A small percentage of vehicles (1.8%) had a score of 10 or more. The remaining vehicles (38.8%) scored between 5 and 9. Results showed no significant differences between sex, age group, or the interaction between sex and age group, but there was a statistically significant difference by household income. Figure 1 shows the mean tread depth scores and 95% confidence intervals by household income group. The lowest income group had higher scores compared to other income groups. However, the scores in general were low, indicating that tread wear was minimal among the vehicles used by the LongROAD cohort.
Tire Pressure Tire pressure data were missing for 131 vehicles. Of the remaining 2,857 vehicles, 6.8% (n=195) had at least one tire underinflated (i.e. tire pressure equal to or less than 25% of the vehicle manufacturer’s recommended tire pressure), 8.6% (n=245) had at least one tire overinflated (i.e. tire pressure equal to or greater than 25% of the recommended tire pressure), and 15.0% (n=429) had at least one tire improperly (i.e., either under- or over-) inflated according to the vehicle manufacturer’s recommended tire pressure.
Analyses compared vehicles with at least one underinflated tire to those with no underinflated tires. Results showed no significant differences between sex, age group, or the interaction between sex and age group. The presence of underinflated tires did differ significantly by household income, with those in the lowest income category having significantly more underinflated tires (15.5%, n=116).
Analyses compared group differences regarding whether or not participants’ vehicles had all tires at the recommended pressure or had at least one under- or overinflated tire. There was a significant difference by household income, but no significant differences were found for sex, age group, or the interaction between sex and age group. Results showed that vehicles in the lowest income category had significantly more overinflated tires compared to the other income groups (18.1%, n=116).
Analyses compared vehicles with at least one improperly inflated tire to vehicles with all tires at the recommended pressure. No significant differences were found for sex, age group, or the interaction between sex and age group. There was a significant difference by household income, with vehicles whose owners were in the lowest income category being more likely to have tires with improper tire pressure (31.9%, n=116).
Damage
The average overall rust score was 6.34 (SD=1.21, range= 6-21). The average overall dent score was 6.70 (SD=1.29; range=6-17). The average overall scratch score was 10.00 (SD=3.4; range=6-24). The average major damage score was 6.04 (SD=0.22, range=6-9 out of 12). Statistical tests showed no significant differences for rust, scratches, or dents by age group. There was a significant main effect of sex, with men having significantly higher average rust scores than women, and women having significantly higher scratch scores than men. All three types of damage differed significantly by household income, with participants in the lowest household income category having higher damage scores compared with the other income groups (see Figure 2 below). Only 3.0% of vehicles had any major damage and only 0.6% had major damage to more than one vehicle region.
Advanced In-Vehicle Technologies
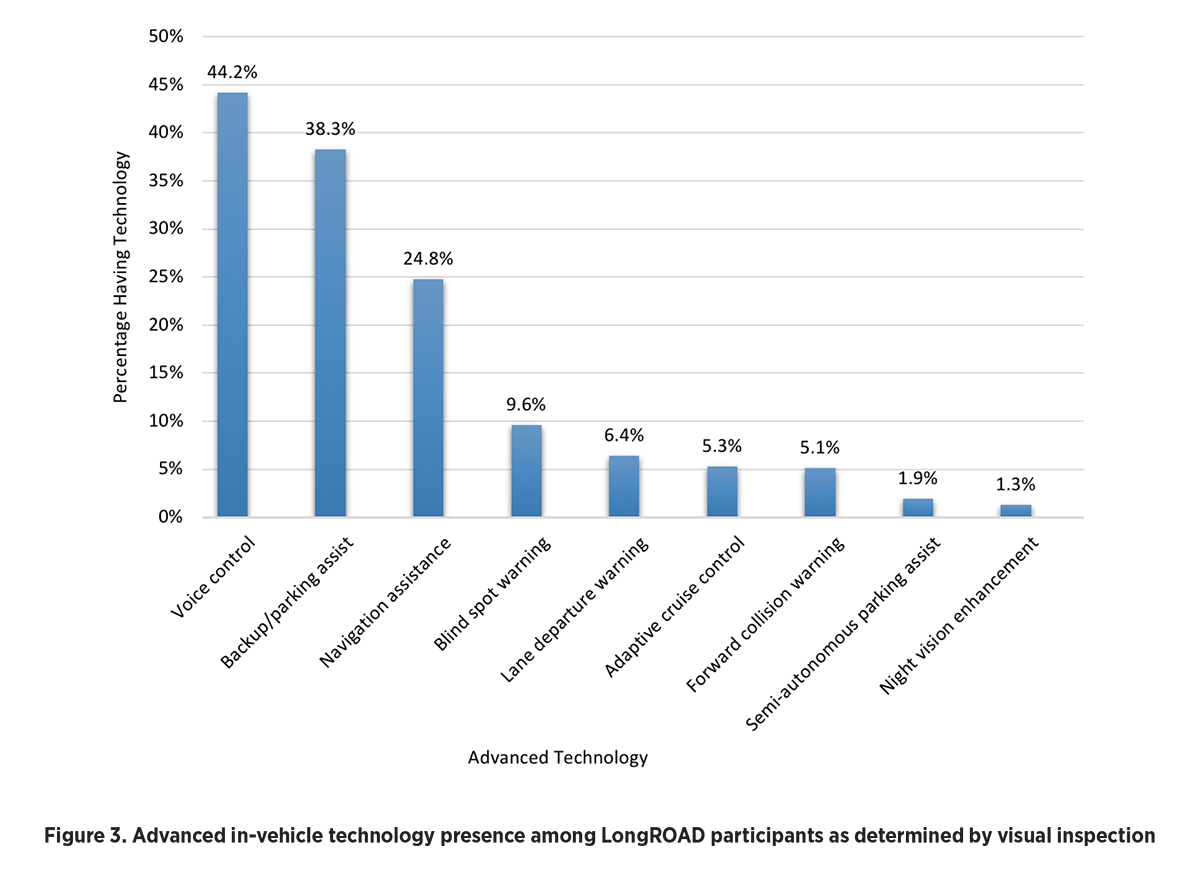
Overall, 52.6% of participants’ vehicles had at least one advanced technology present, while 26.6% had two to three technologies present, and 10.7% had more than three technologies. Figure 3 shows the prevalence of each technology recorded during the inspection. Results from statistical analyses by demographics showed that the presence of technologies was only correlated with income, with the number of technologies present increasing as household income increased.
Aftermarket Vehicle Adaptations
Aftermarket adaptations were present in 21.7% (n=645) of vehicles, with 3% of vehicles having two or more adaptations. Figure 4 shows the percentage of each adaptation in participants’ vehicles among those participants who had at least one adaptation (as determined by inspection). Adaptations not present in any vehicle are not included in this figure. Steering knob, spin pin, V-grip, palm grip, tri-pin, steering splint, and amputee ring are combined into a single category called steering wheel modification. Results showed that women had significantly more adaptations than men. Results also showed differences by age group, with participants in the 75-79 age group having significantly more adaptations than those in the 65-69 age group. There was also a significant effect of household income. Results showed that this main effect was due to participants in the $20,000-$49,999 income group having significantly more adaptations than those in the two highest income groups.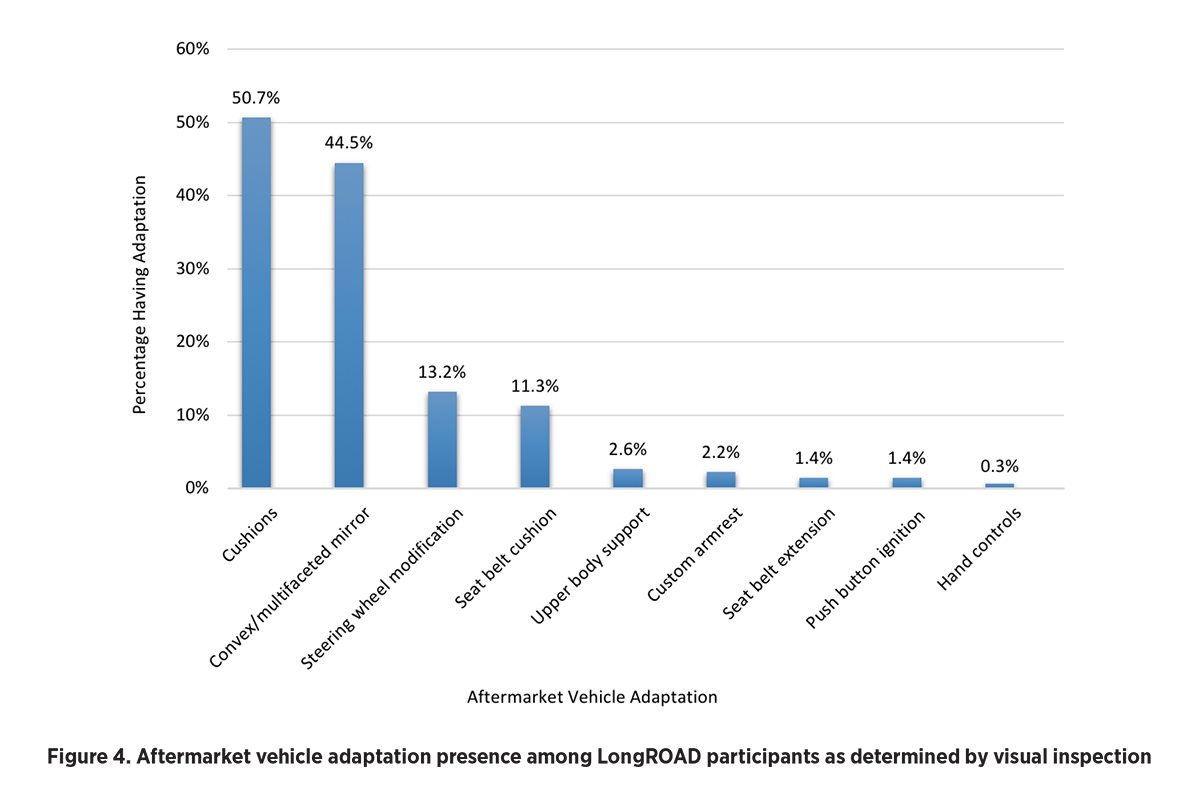
Discussion
This study found that among a large cohort of older drivers, vehicles were well maintained, had little damage, and contained a wide range of advanced technologies and some aftermarket adaptations. A common finding was that the vehicles of older drivers with low household incomes were significantly different, in many cases, than vehicles used by older drivers in other income categories. In general, the vehicles of older drivers in the lowest income category were less well maintained, had more damage, and contained fewer technologies and more aftermarket adaptations. For metrics that one would logically associate with traffic safety (i.e., tire tread depth, tire pressure, dents, scratches, major damage, and the presence of advanced technology), vehicles of older drivers in the lowest income group had scores indicating that they were potentially less safe than their counterparts in other income groups. Regarding tire tread, this result could be due to the relatively high cost of replacing tires. Maintaining proper tire pressure, however, involves regular monitoring of tires and adjusting pressure as needed, which does not necessarily require higher incomes to perform. It is likely that people with higher incomes get their vehicles serviced more regularly and have newer cars, leading to better monitoring of tire pressure. These results suggest that efforts should be made to better market existing resources on the importance of proper vehicle maintenance to lower income older adults, such as Senior Driving.com: How to Maintain your Vehicle (AAA, 2017) and Tire Safety: Everything Rides on It (NHTSA, 2001).
The prevalence data for in-vehicle technologies and aftermarket adaptations presented here provide an interesting contrast to the results presented in an earlier brief (Eby et al., 2017). In this brief, all data on these topics were derived from visual inspection, whereas in the earlier brief, the data were self-reported. In most cases, the two types of prevalence data were in relatively good agreement. However, in a few cases, there were discrepancies. There could be a number of reasons for this. First, there were items inspected for that participants were not asked about in the survey. Second, participants may not consider some of these adaptations to be adaptations. Third, participants may be unaware of the technologies in their vehicle. Fourth, inspectors could not visually determine which technologies were in the vehicle. Finally, there could have been error in knowing whether a technology or adaptation was standard or a modification. Nevertheless, both sources of prevalence provide valuable information.
The strengths of this study included the use of a large sample of vehicles of older drivers recruited from five distinct geographic locations in the United States, and objective examination of a wide range of maintenance, damage, technologies and vehicle adaptations. Among the limitations were our lack of knowledge about the history of the vehicle prior to the inspection, and possible use of the vehicle by nonparticipants, which could have adversely impacted maintenance and damage. As this longitudinal study progresses, we will be able to account for many of these factors. Another limitation is that the LongROAD cohort is relatively well educated with high household incomes and, therefore, not representative of all older adult drivers. As such, these results may not generalize to all older driver populations.
References
AAA (2017). How to Maintain Your Vehicle. URL: http://seniordriving.aaa.com/maintain-mobility-independence/car-buying-maintenance-assistive-accessories/how-maintain-your/. Accessed, November, 2017.
Eby, D.W., Molnar, L.J., Zakrajsek, J., Ryan, L., Zanier, N., St. Louis, R.M., Stanciu, S., LeBlanc, D, Kostyniuk, L.P., Smith, J., Yung, R., Nyquist, L., DiGuiseppi, C., Li, G., Mielenz, T.J., Strogatz, D. & the LongROAD Research Team. (2017).
In-Vehicle Technologies, Vehicle Adaptations, and Older Drivers: Use, Learning, and Perceptions. Research Brief. Washington, DC: AAA Foundation for Traffic Safety.
Li, G., Eby, D.W., Santos, R., Mielenz, T.J., Molnar, L.J., Strogatz, D., Betz, M., DiGuiseppi, C., Ryan, L.H., Jones, V., Pitts, S.I., Hill, L.L., DiMaggio, C., LeBlanc, D., & Andrews, H.F. for the LongROAD Research Team. (2017). Longitudinal Research on Aging Drivers (LongROAD): Study design and methods. Injury Epidemiology, 4, 22.
National Highway Traffic Safety Administration (2001). Tire Safety: Everything Rides on It. Report No. DOT HS 809 361. Washington, DC: National Highway Traffic Safety Administration.
Suggested Citation
For media inquiries, contact:
Tamra Johnson
202-942-2079
TRJohnson@national.aaa.com