2022 Traffic Safety Culture Index
The 2022 iteration of the annual Traffic Safety Culture Index describes Americans’ perceptions of, attitudes towards and engagement in dangerous driving behaviors and identifies profiles of risky driving.
November 2023
Introduction
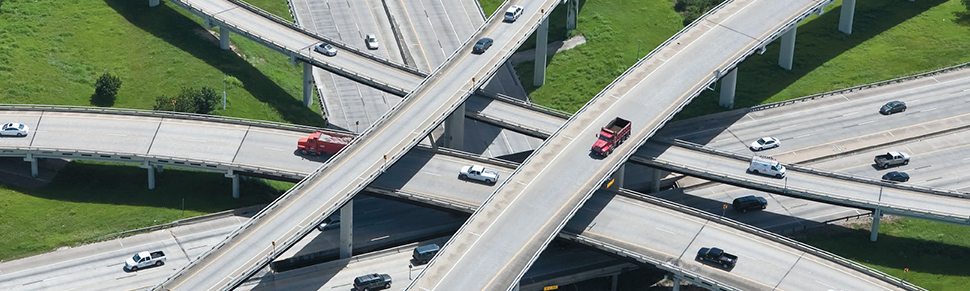
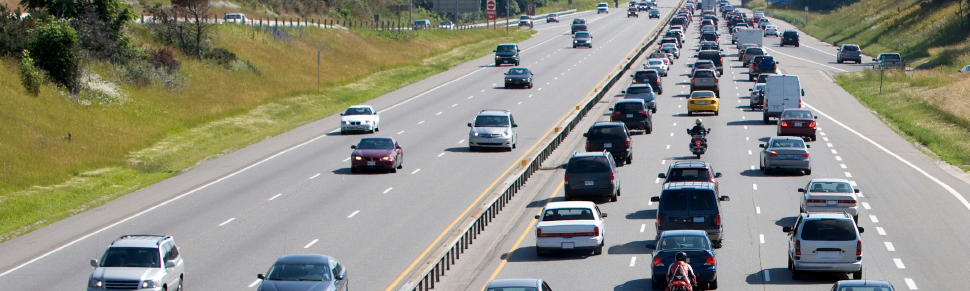
As the United States continues to recover from the COVID-19 pandemic, traffic fatalities remain unacceptably high. Risky driving behaviors such as speeding and impaired driving play a critical role in road traffic crashes and contribute to an unsafe transportation environment for Americans traveling both inside and outside vehicles.
The 2022 Traffic Safety Culture Index provides insights into understanding public perceptions, attitudes toward, and engagement in unsafe driving behaviors. This report examines patterns of responses to questions on engagement in driving behaviors to identify and describe risky driving profiles.
Methodology
The 2022 TSCI survey used a probability-based sampling panel representative of the U.S. population to collect data between July 28 and August 29, 2022. Descriptive analyses were conducted based on weighted data that consisted of 2,499 licensed drivers ages 16 or older who completed the online survey and reported driving at least once in the past 30 days before the survey. Additional analyses used a latent class approach to identify and describe profiles of risky driving.
Key Findings
- Roughly 93% of drivers identify both texting/emailing and reading on a hand-held cell phone as very or extremely dangerous. Despite these perceptions, more than a quarter of drivers (27%) reported having sent a text/email while driving and 38% reported reading a text/email while driving.
- Drivers predominantly agreed that people important to them would disapprove of them engaging in distracted driving behaviors (87%–95% depending on the behavior).
- Most respondents believe driving through a red light (83%) or driving aggressively including switching lanes quickly and driving closely behind other vehicles (89%) is very or extremely dangerous.
- Fewer drivers perceive speeding as a dangerous activity and the speeding behaviors have the lowest perceived social disapproval of all the examined unsafe driving behaviors.
- Drivers predominantly perceive drowsy driving to be very or extremely dangerous (95%); however, 18% of drivers reported having engaged in the behavior in the past 30 days.
- Drivers overwhelming perceived driving after drinking alcohol (94%) as very or extremely dangerous and 68% believed such a driver would be likely to be apprehended by police. Only 7% of respondents reported having engaged in this behavior in the past 30 days.
- By comparison, only 70% of drivers felt driving (within an hour) after using marijuana to be very or extremely dangerous and 26% believe such a driver would be likely to be apprehended by police. Only 6% of respondents reported having engaged in this behavior in the past 30 days.
Identifying Profiles of Risky Driving Behavior Engagement
- Based on the patterns of reported risky driving behavior engagement, the following six unique groups were identified using a latent class analysis (LCA) and interpreted:
- Safe Drivers (41.2%): Few engaged in any risky driving behavior.
- Distracted Drivers (15.0%): Predominantly engaged in all distracted driving behaviors.
- Speeding Drivers (22.7%): Predominantly engaged in speeding behaviors.
- Distracted and Aggressive Drivers (17.3%): Predominantly engaged in both distracted driving and aggressive driving behaviors.
- Impaired Drivers (1.3%): Predominantly engaged in impaired driving (e.g., drunk driving).
- Most Dangerous Drivers (2.4%): Engaged in all risky driving behaviors.
- There were notable population group differences by driving profile: Distracted Drivers, Distracted and Aggressive Drivers, and Most Dangerous Drivers were on average approximately 40 years of age (~13 years younger than members of the other groups).
- 14% of respondents were from non-metropolitan locations; however, 37% of Impaired Drivers resided in non-metropolitan settings.
Authors
Suggested Citation
AAA Foundation for Traffic Safety. (2023). 2022 Traffic Safety Culture Index (Technical Report). Washington, D.C.: AAA Foundation for Traffic Safety.