
American Driving Survey, 2015 – 2016
This Research Brief provides highlights from the AAA Foundation’s 2016 American Driving Survey, which quantifies the daily driving of the general public in the United States. Comparisons to data from 2015 are also provided.
January 2018
Suggested Citation
For media inquiries, contact:
Jeanette Casselano
202-942-2702
jcasselano@national.aaa.com
Abstract
This Research Brief provides highlights from the AAA Foundation for Traffic Safety’s 2016 American Driving Survey, which quantifies the daily driving patterns of the general public in the United States. On average, drivers reported making 2.2 driving trips per day, spending 50.6 minutes on the road and driving 31.5 miles. Projecting these results to all drivers nationwide, U.S. drivers made an estimated total of 186 billion driving trips, spent 70 billion hours driving and drove 2.62 trillion miles in 2016. This Research Brief presents additional information about the driving of the American public in 2016 as well as changes relative to 2015.
Methods
The methodology of the American Driving Survey is described in detail in Triplett et al. (2016) and is summarized briefly here.
Data were collected in telephone interviews conducted by landline and cellular phone with a sample of respondents selected using random-digit-dial telephone survey methods. In the interviews, a household member aged 18 or older was asked to report basic demographic information and frequency of driving for all household members aged 16 or older. A driver from the household was then selected and asked a series of questions regarding all of the driving that he or she did over a 24-hour period from 3 a.m. the day before the interview to 3 a.m. the day of the interview. If the household included multiple drivers, one or more drivers were selected at random using an algorithm that oversampled teenage drivers, drivers aged 75 and older, and drivers reported to drive more frequently. Data regarding the length in miles and duration in minutes of all driving trips, the number of passengers present, and the type of vehicle driven were also collected. Approximately equal numbers of interviews were collected on each day throughout the year, and imbalances in the distribution of interviews across days of the week were corrected through weighting. American Driving Survey interviews have been conducted daily from May 2013 through December 2017; data presented in this Research Brief were collected between Jan. 1, 2015 and Dec. 31, 2016.
Estimates of daily driving were obtained by computing the mean numbers of trips, minutes, and miles of driving reported by respondents. Estimates of total trips, minutes, and miles driven by all drivers nationwide were obtained by multiplying those driver-level means by the estimated total number of drivers in the U.S.
Data were weighted to adjust for respondents’ probabilities of being selected to participate in the survey and to align the demographic characteristics of the survey respondents with those of the general population with respect to age, race/ethnicity, level of education, and region of the country as estimated by the U.S. Census Bureau (ACS, 2015). All statistics presented in this report other than sample sizes are based on weighted data. Statistics reported here for year 2015 may differ slightly from those published previously, because weights for year 2015 data were originally calculated using a U.S. Census Bureau data from 2014 but were subsequently updated using data from 2015.
In 2016, basic demographic and driver information were obtained from 3,797 households and 3,161 drivers reported information about their driving on the day before the interview. The overall driver-level response rate for the survey in 2016 was 19.8%.
Results
General Driving
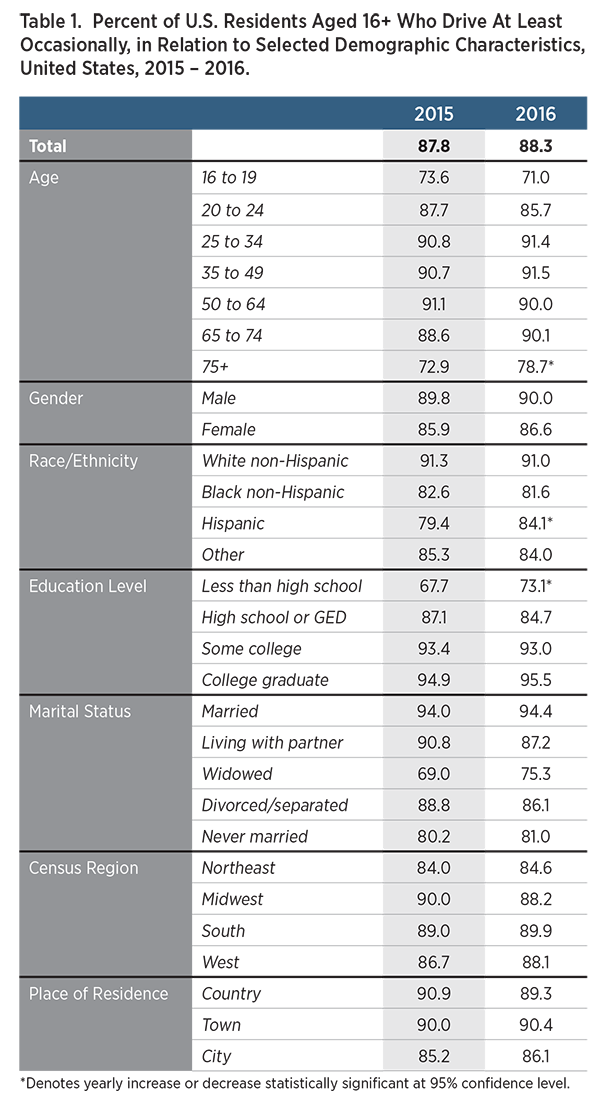
Table 1 shows the percentage of the population that reported driving in 2015 and in 2016. Overall, 88.3% of all U.S. residents ages 16 and older reported that they drove at least occasionally in 2016, an increase of 0.5 percentage points relative to the previous year. Similar to the results in 2015, the proportion of the population that drove
was higher for middle-aged respondents than for the youngest or oldest, higher for men than for women, higher for non-Hispanic whites than for people of other races, higher for married people than for those who were not married, higher for those with higher levels of education than for those with lower levels of education, higher in all other regions than in the Northeast and higher for people who live in the country or in towns than for those who live in cities. There were statistically significant year-over-year increases in the proportion of the population who reported driving for respondents aged 75 and older, respondents who had not completed high school, and for respondents who describe themselves as Hispanic.
Driving Trips
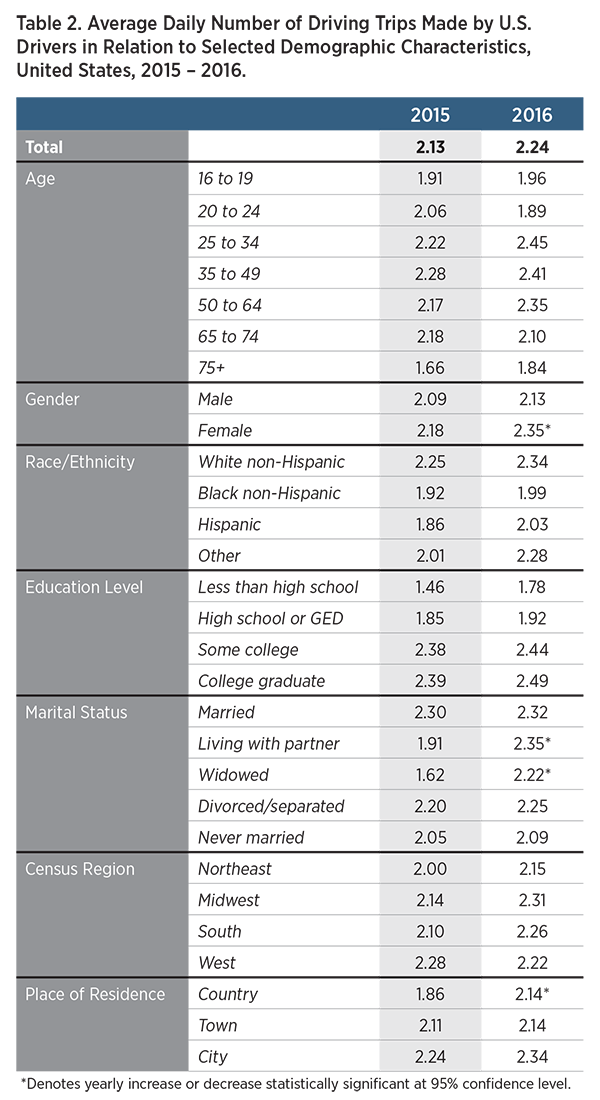
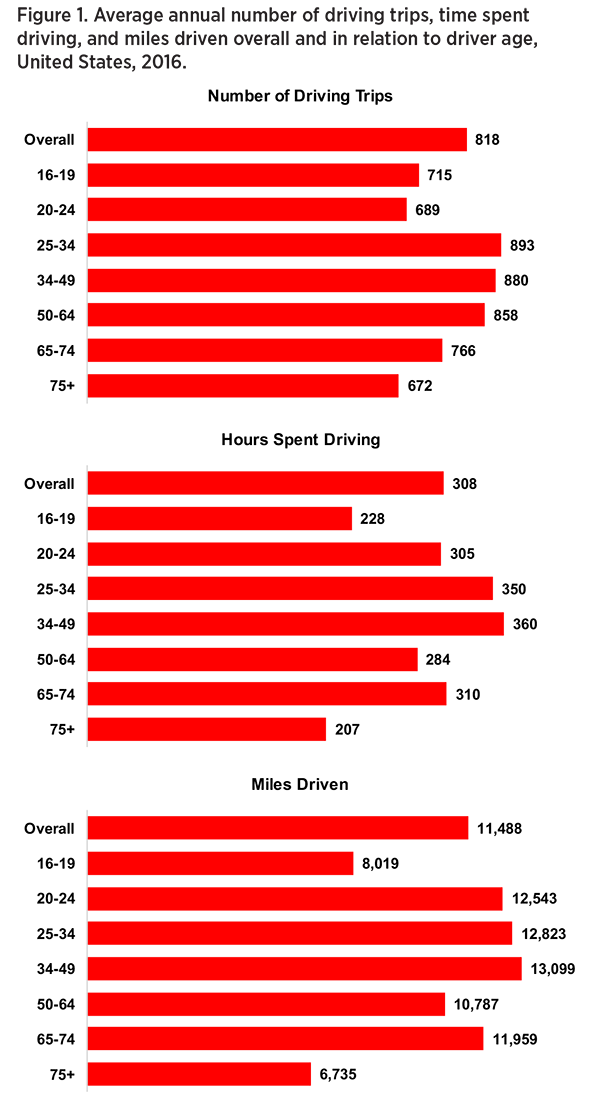
Drivers made an average of 2.24 driving trips per day in 2016, a slight increase over the 2.13 daily driving trips reported in 2015 (Table 2). Drivers ages 25-34 and 35-49 reported the greatest number of trips, whereas drivers ages 75 years and older reported the fewest. Women reported more daily trips than men, non-Hispanic white drivers reported more trips than drivers of other races, drivers with higher levels of education reported more trips than drivers with lower levels of education across all categories, and drivers in cities reported more daily trips than drivers who described their place of residence as the country or a town. The mean daily number of driving trips increased significantly from 2015 to 2016 for women, people who were living with a partner or widowed and people who lived in the country.
Driving Time
Drivers spent an average of 50.6 minutes per day driving in 2016, a slight increase over the 48.4 minutes reported in 2015 (Table 3). Drivers ages 25-34 and 35-49 spent the greatest amount of time driving, whereas the youngest and oldest drivers spent the least time driving. In 2016, on average, men spent about nine more minutes driving than women did. Generally, time spent driving increased as drivers’ level of education increased. Drivers who were married or living with a partner spent more time driving than did drivers who were divorced/separated, widowed, or never married. The regional distribution of time spent driving appeared to change substantially from 2015 to 2016; however, none of the year-over-year changes were statistically significant.
Miles Driven
Respondents drove an average of 31.5 miles per day in 2016, up slightly from 30.0 miles per day in 2015 (Table 4). As with daily trips and daily time spent driving, drivers ages 25-34 and 35-49 reported driving the most miles daily; teens and drivers ages 75 years and older reported driving the least. In 2016, on average, men drove about eight miles more than women each day. Drivers who were college graduates or who had attended at least some college reported driving more miles than did drivers with lower levels of education; however, drivers who had not completed high school reported driving significantly more miles in 2016 than in 2015. Drivers who were married reported driving more miles than drivers who were not married. In a substantial change from 2015, drivers in the West reported driving more miles on average than did drivers in any other region, and their year-over-year increase was statistically significant. Drivers who described the area where they live as the country reported driving more miles on average than did drivers who lived in towns or cities.
Driving Population Estimates
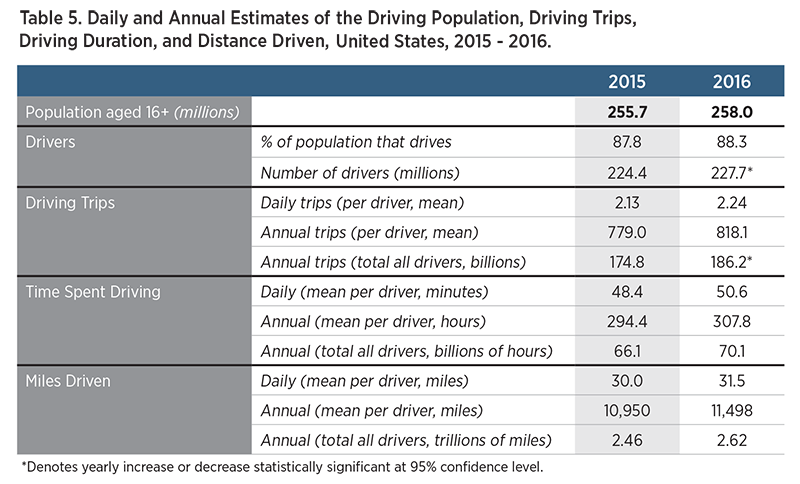
In addition to changes in the proportion of the population that drives and the average amount of driving per driver, the “driving aged” population (i.e., ages 16 years and older) of the U.S. also increased from 2015 to 2016, which contributed to an increase in the total number of drivers on the road. This also contributed to an increase in the total amount of driving in 2016 compared with in 2015 (Table 5). The number of drivers in the U.S. increased by 3.3 million, from 224.4 million in 2015 to 227.7 million in 2016. The total number of driving trips made by all drivers nationwide increased from 175 billion in 2015 to 186 billion in 2016, the total number of hours spent driving increased from 66 billion to 70 billion, and the total number of miles driven increased from 2.46 trillion to 2.62 trillion.
Discussion
In this third annual edition of the American Driving Survey, data indicated that drivers in the United States made an average of 2.2 driving trips per day, spending 50.6 minutes driving approximately 31.5 miles. Projecting these results to all drivers nationwide, U.S. drivers made an estimated total of 186 billion driving trips, spent 70 billion hours driving and drove 2.62 trillion miles in 2016.
Compared with the previous year, both the size of the driving population and the total number of driving trips taken by all drivers increased significantly. The total amount of time that drivers spent behind the wheel and the number of miles that they drove appeared to increase as well; however, these changes were not statistically distinguishable from random variation given the limited sample size of the survey and the variability of the data.
Subgroup comparisons, e.g., changes in the amount of driving by people in specific demographic groups or regions, should be treated with substantial caution as well, as most of the year-over-year changes in driving exposure among subgroups were not statistically significant at the 95% confidence level. A few exceptions were noted, however. For example, there were large and statistically significant increases from 2015 to 2016 in the proportions of the population who reported driving among people aged 75 and older, Hispanics and people of lower educational attainment.


References
American Community Survey/ACS (2015). 1 year Public Use Microdata Samples (PUMS). https://factfinder.census.gov/faces/affhelp/jsf/pages/metadata.xhtml?lang=en&type=document&id=document.en.ACS_pums_sas_2015#main_content
Triplett T, Santos R, Rosenbloom S. (2016). American Driving Survey: 2014-2015. Washington, D.C.: AAA Foundation for Traffic Safety.
Acknowledgments
The research described in this research brief was performed by the Urban Institute, Washington, D.C.
Suggested Citation
For media inquiries, contact:
Jeanette Casselano
202-942-2702
jcasselano@national.aaa.com