Prevalence of Drowsy Driving Crashes: Estimates from a Large-Scale Naturalistic Driving Study
The contribution of drowsy driving to motor vehicle crashes is notoriously difficult to quantify. This study examines in-vehicle video captured in a large naturalistic driving study to estimate the proportion of motor vehicle crashes that involve drowsy driving.
February 2018
Suggested Citation
For media inquiries, contact:
Tamra Johnson
202-942-2079
TRJohnson@national.aaa.com
Abstract
While official statistics from the U.S. government indicate that only approximately 1%–2% of all motor vehicle crashes involve drowsy driving, many studies suggest that the true scope of the problem is likely to be much greater. This Research Brief describes a study that examined the prevalence of driver drowsiness immediately prior to crashes that occurred in the context of a large-scale naturalistic driving study in which the driving of more than 3,500 people was monitored continuously for a period of several months using in-vehicle cameras and other data collection equipment. Drowsiness was assessed using a validated measure that is based on the percentage of time that a person’s eyes are closed. Using this measure, drowsiness was identified in 8.8%–9.5% of all crashes examined and 10.6%–10.8% of crashes that resulted in significant property damage, airbag deployment, or injury.
Methods
The data analyzed for this study were collected as a part of the federally funded Second Strategic Highway Research Program Naturalistic Driving Study (SHRP 2 NDS). Briefly, 3,593 drivers were recruited at various times from six sites around the U.S. to participate in a study in which their driving and in-vehicle behaviors were monitored continuously using in-vehicle cameras and other data collection equipment for a period of several months between October 2010 and December 2013 as they drove in their own vehicles. The sample was generally representative of the driving public with the exception that younger and older drivers were deliberately oversampled. The study protocol and sample of drivers are described in detail in Dingus et al. (2015) and Antin et al. (2015).
In the current study, drowsiness was assessed using the PERCLOS measure, which is the percentage of time that a person’s eyes are closed over a defined measurement interval (Wierwille et al., 1994). PERCLOS has been shown to be predictive of drowsiness, lapses in attention, and increased variability in lane position (Wierwille et al., 1994; Dinges et al., 1998; Jackson et al., 2016). Trained data reductionists viewed the final three minutes of video preceding each crash (recorded at 15 frames per second) frame-by-frame and coded whether the driver’s eyelids were open or closed in each frame. The final one minute of video preceding the crash was analyzed if three full minutes of usable data were not available. The operational definition of “closed” was that the eyelids were more than 80% closed or covering the pupil. As in previous studies, the driver was classified as drowsy if the driver’s eyes were closed in 12% or more of the video frames in the three-minute or one-minute period preceding the crash (Wierwille et al., 1994; Hanowski et al., 2008).
A total of 905 severe, moderate, and minor crashes that occurred during the SHRP 2 NDS were initially included in the current study; this number did not include 628 other crashes that were classified as “low-risk tire strikes.” (Hankey et al. [2016] provides a detailed description of the classification of crash severity in the SHRP 2 NDS.) Crashes in which the driver’s eyes were not visible for at least 75% of the coding period (e.g., due to glare, dark sunglasses, or poor video quality) or in which the driver was not in the driver’s seat for the entire coding period were also excluded (n=204). Ultimately, PERCLOS was coded for the full three minutes preceding each of 589 crashes and for one minute preceding each of an additional 112 crashes (701 total).
Results
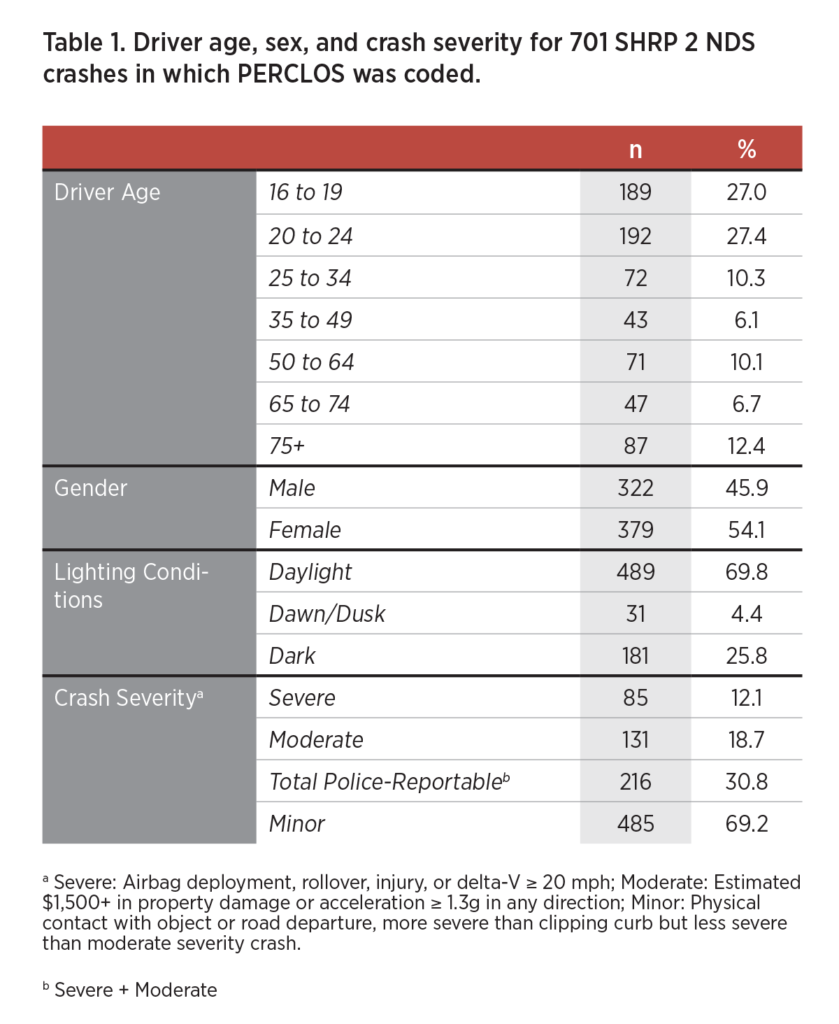
Table 1 shows the breakdown of crashes examined in this study by age and sex of the driver involved, lighting conditions present and the severity of the crash. A high proportion of crashes involved drivers under age 25, a consequence of both their elevated crash rates (Tefft, 2017) and the deliberate oversampling of younger drivers in the SHRP 2 NDS (Antin et al., 2015). Approximately 31% of crashes examined were classified as severe or moderately severe. These crashes resulted in significant property damage, airbag deployment, rollover, injury, or substantial change in speed associated with the crash impact. Although not all of these crashes were necessarily reported to the police, they were severe enough to have likely met the police-reporting thresholds in most jurisdictions (Hankey et al., 2016). The remaining 69% of crashes were of lower severity and generally were not police-reportable.
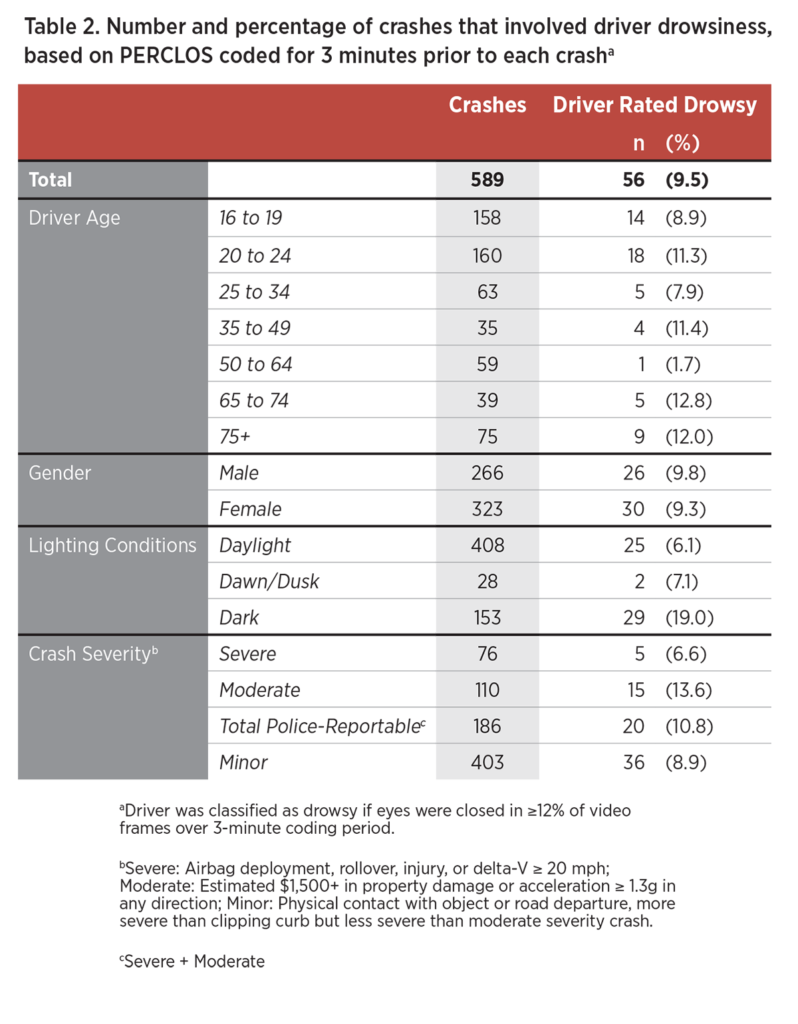
Table 2 shows the number and proportion of crashes in which the driver was found to be drowsy based on PERCLOS calculated over the three minutes immediately prior to the crash. Overall, the driver was classified as drowsy in 9.5% of all crashes. The proportion of crashes that involved drowsiness varied significantly in relation to lighting conditions (P < 0.001; Fisher’s exact test), with drowsiness evident in over three times the proportion of crashes in darkness as in daylight. Also of note, more than half of all crashes that involved drowsiness occurred in darkness. Variation by age, sex, and crash severity was not statistically significant (all P > 0.20). Results were similar in analyses limited to police-reportable crashes, with 10.8% of these higher-severity crashes involving drowsiness.
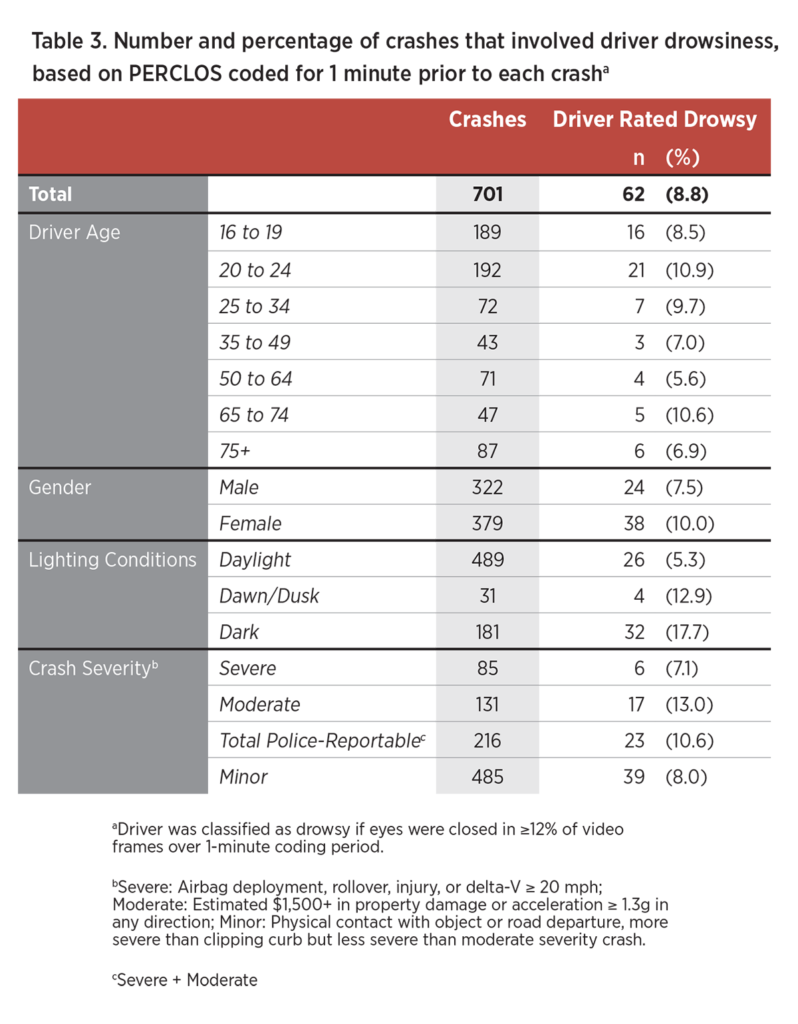
Table 3 shows the number and proportion of crashes in which the driver was found to be drowsy based on PERCLOS calculated over only the final one minute prior to the crash, which enabled the inclusion of 112 additional crashes for which three full minutes of video were not available. The driver was classified as drowsy in 8.8% of all crashes by this measure. The proportion of crashes that involved drowsiness varied significantly in relation to lighting conditions (P < 0.001); variation by age, sex, and crash severity again were not statistically significant (all P ≥ 0.17). Results were similar in analyses limited to police-reportable crashes, with 10.6% involving drowsiness.
Discussion
This is the first study to use the validated PERCLOS measure to quantify the proportion of crashes in which the driver was drowsy using pre-crash video from a large sample of crashes that involved members of the U.S. general driving population. Results indicated that observable driver drowsiness, assessed on the basis of eyelid closures, was present in an estimated 8.8%–9.5% of all crashes and 10.6%–10.8% of those severe enough to be reportable to the police.
The results of this study stand in stark contrast to official statistics published by the National Highway Traffic Safety Administration (NHTSA), which report that driver drowsiness was involved in an estimated 1.4% of all police-reported crashes nationwide, 2.0% of crashes that resulted in injuries and 2.4% of crashes that resulted in a death in years 2011–2015 (National Center for Statistics & Analysis, 2017). Experts have long regarded such statistics, derived from police reports based on post-crash investigations, as vast underestimates of the scope of the problem. Stutts et al. (2005), for example, likens crashes in which the police report drowsy driving to the tip of an iceberg, where much of the problem remains out of view beneath the surface. Unlike impairment by substances such as alcohol, there is no test analogous to a breathalyzer that the police can administer at the roadside to assess a driver’s level of drowsiness at or shortly after the time of a crash. Moreover, a driver who was drowsy before a crash may appear fully alert afterward and may be reluctant to volunteer to the police that he or she was drowsy. In the case of a driver who was not actually asleep at the time of the crash but was operating at a reduced level of alertness, the driver may not even recognize that he or she was drowsy nor that drowsiness may have contributed to the crash. In extreme cases, all relevant information about the driver’s pre-crash state is lost if the driver is deceased and there are no passengers able to provide information about the driver’s pre-crash state. Thus, sources of data beyond standard police reports are necessary to develop accurate estimates of the proportion of crashes that involve driver drowsiness.
Other studies have attempted to estimate the proportion of crashes that involve driver drowsiness by developing statistical models that distinguish between crashes that involved drowsiness versus those that did not, based on readily observable crash characteristics, in samples of crashes in which drowsiness was confirmed with some degree of confidence. They then used those models to estimate the proportion of all crashes that involved drowsiness. One such study by Masten et al. (2006) estimated that approximately 15% of all drivers involved in fatal crashes in the U.S. were drowsy. Another study by the AAA Foundation for Traffic Safety estimated that 7% of all reported crashes, 13% of crashes that resulted in severe injuries, and 16.5% of fatal crashes involved a drowsy driver (Tefft, 2012). The SHRP 2 NDS involved few crashes that resulted in severe injuries and no fatal crashes; thus, the results of the current study arguably are most directly comparable to the estimates of Tefft (2012) with respect to all crashes taken together, rather than those for crashes that resulted in severe injuries or fatalities. Thus, the results of the current study corroborate the general conclusions of previous studies, namely that crashes involving driver drowsiness are much more prevalent than official statistics indicate.
No fatal crashes occurred in the SHRP 2 NDS, so the results of the current study cannot be generalized directly to fatal crashes. Of note, however, is the fact that crashes that occurred in darkness were more than three times as likely as those that occurred during daylight to involve drowsiness. While the proportion of crashes that occurred in darkness in the current study was similar to the corresponding proportion among all police-reported crashes nationwide
(26%), the proportion of fatal crashes that occur in darkness is much higher, at 48% (NHTSA, 2017). In addition, other studies such as Tefft (2012) have estimated that drowsiness is a factor in a much greater percentage of fatal crashes than in less severe crashes. Collectively, these results provide additional suggestive evidence that the proportion of fatal crashes that involve driver drowsiness is likely substantial.
This study has several limitations that should be noted. Drivers in this study were volunteers in a federally funded study that involved placing cameras in their vehicles. It is possible that these drivers and their behavior differed somewhat from the population at large; the extent to which they may be more or less likely than members of the general population to drive while drowsy is unknown. In addition, the SHRP 2 NDS oversampled younger and older drivers. Drivers under age 25 accounted for more than half of all crash-involved drivers in the current study, compared with 23% of all crashes nationwide (NHTSA, 2017). However, the proportion of crashes found to involve drowsiness did not vary significantly by age in the current study; thus, the over-representation of young drivers should not itself significantly influence the overall results. Additionally, 23% of crashes were excluded due to inability to see the driver’s eyes well enough to code PERCLOS. It is possible that drowsiness may have been more or less prevalent in those excluded crashes; however, most exclusions were due to factors such as poor video quality or glare, which would not be expected to be correlated with drowsiness. Finally, it is possible that some drivers who did not meet the current study’s criteria for classification as drowsy (i.e., eyes closed for 12 percent or more of the one- or three-minute coding window) may have nonetheless been drowsy at the times of the crashes. In a more subjective assessment of drowsiness not included in the current study, data reductionists viewed only the final six seconds of video prior to each crash and coded drowsiness based only on obvious signs (e.g., yawning, rubbing eyes, slack musculature, etc.). In this more subjective assessment, a small number of additional drivers who did not meet the objective PERCLOS-based criteria for drowsiness were judged to have been drowsy at the times of crashes.
Experts recommend that adults should sleep for least seven hours each night for optimal health (Watson et al., 2015). Previous research by the AAA Foundation for Traffic Safety has found that driving after having slept for less than seven hours in a 24-hour period is associated with measurably elevated crash rates (Tefft, 2016). Driver drowsiness is an under-reported traffic safety problem, largely because its role in crashes is typically difficult to ascertain. Naturalistic driving data can provide a unique window into the state of the driver in the moments leading up to a crash. By applying a validated measure of drowsiness to a sample of crashes captured on video in a large naturalistic driving study involving members of the general driving population, this study found that 8.8%–9.5% of all crashes and 10.6%–10.8% of crashes severe enough to be reported to the police involved driver drowsiness. These results suggest that driver drowsiness is a substantially larger problem than official government statistics indicate.
References
Antin, J., Stulce, K., Eichelberger, L., & Hankey, J. (2015). Naturalistic Driving Study: Descriptive Comparison of the Study Sample with National Data. SHRP 2 Report S2-S31-RW-1. Washington, D.C.: Transportation Research Board.
Dinges, D. F., Mallis, M. M., Maislin, G., Powell, J. W. IV. (1998). Final Report: Evaluation of Techniques for Ocular Measurement as an Index of Fatigue and as the Basis for Alertness Management. Report DOT HS 808
762. Washington, D.C.: National Highway Traffic Safety Administration.
Dingus, T. A., Hankey, J. M., Antin, J. F., Lee, S. E., Eichelberger, L., Stulce, K. E., McGraw, D., Perez, M. A.,. Stowe, L. (2015). Naturalistic Driving Study: Technical Coordination and Quality Control. SHRP 2 Report S2-S06-RW-1. Washington, D.C.: Transportation Research Board.
Hankey, J. M., Perez, M. A., McClafferty, J. A. (2016). Description of the SHRP 2 Naturalistic Database and the Crash, Near-Crash, and Baseline Data Sets. Blacksburg, VA: Virginia Tech Transportation Institute.
Hanowski, R. J., Blanco, M., Nakata, A., et al. (2008). The Drowsy Driver Warning System Field Operational Test: Data Collection Methods. Report No. DOT HS 811 035. Washington, D.C.: National Highway Traffic Safety Administration.
Jackson, M. L., Raj, S., Croft, R., J., Hayley, A. C., Downey, L. A., Kennedy, G. A., Howard, M. E. (2016). Slow eyelid closure as a measure of driver drowsiness and its relationship to performance. Traffic Injury Prevention, 17(3): 251-257.
Masten, S. V., Stutts, J. C., Martell, C.A. (2006). Predicting daytime and nighttime drowsy driving crashes based on crash characteristic models. 50th Annual Proceedings of the Association for the Advancement of Automotive Medicine; Chicago, IL; October 2006.
National Center for Statistics and Analysis. (2017, October). Drowsy Driving 2015 (Crash•Stats Brief Statistical Summary. Report No. DOT HS 812 446). Washington, D.C.: National Highway Traffic Safety Administration.
National Highway Traffic Safety Administration. (2017). Traffic Safety Facts 2015. DOT HS 812 384). Washington, D.C.: National Highway Traffic Safety Administration.
Stutts, J., Knipling, R. R., Pfefer, R., Neuman, T. R., Slack, K. L., Hardy, K. K. (2005). NCHRP Report 500. Guidance for Implementation of the AASHTO Strategic Highway Safety Plan. Volume 14: A Guide for Reducing Crashes Involving Drowsy and Distracted Drivers. Washington, D.C.: Transportation Research Board.
Tefft, B. C. (2017). Rates of Motor Vehicle Crashes, Injuries, and Deaths in Relation to Driver Age, United States, 2014-2015 (Research Brief). Washington, D.C.: AAA Foundation for Traffic Safety.
Tefft, B. C. (2016). Acute Sleep Deprivation and Risk of Motor Vehicle Crash Involvement. Washington, D.C.: AAA Foundation for Traffic Safety.
Tefft, B. C. (2012). Prevalence of motor vehicle crashes involving drowsy drivers, United States, 1999-2008. Accident Analysis & Prevention, 45(1): 180-186.
Watson, N. F., Badr, M. S., Belenky, G., et al. (2015). Recommended amount of sleep for a healthy adult: A joint consensus statement of the American Academy of Sleep Medicine and Sleep Research Society. Journal of Clinical Sleep Medicine, 11(6): 591-592.
Wierwille, W. W., Wreggit, S. S., Kirn, C. L. Ellworth, L. A., & Fairbanks, R. J. (1994). Research on Vehicle-Based Driver Status/Performance Monitoring; Development, Validation, and Refinement of Algorithms for Detection of Driver Drowsiness. Report DOT HS 808 247. Washington, D.C.: National Highway Traffic Safety Administration.
Suggested Citation
For media inquiries, contact:
Tamra Johnson
202-942-2079
TRJohnson@national.aaa.com

