
Travel in the United States Before and During the COVID-19 Pandemic
This research brief aims to quantify month-to-month changes in average daily travel from July 2019 through December 2020 using data from the AAA Foundation for Traffic Safety’s New American Driving Survey.
July 2021
Introduction
The COVID-19 pandemic, the associated policy interventions such as stay-at-home orders, and the associated economic recession all had profound influences on how much Americans traveled and how they traveled in 2020.
Data from sources such as vehicle counts and cell phone records have been used to estimate the overall magnitude of the change in travel at the national and state levels, however, little information is available regarding changes in the composition of travel (e.g., characteristics of road users; mode and purpose of travel). The current study aims to quantify changes in monthly travel from July 2019 through December 2020 using data from the AAA Foundation for Traffic Safety’s New American Driving Survey, which interviews a sample of U.S. residents every day to collect information about their travel on the previous day. This enables examination of changes in travel in relation to the pandemic not only overall but in relation to the characteristics of the travelers and their trips.
Key Findings
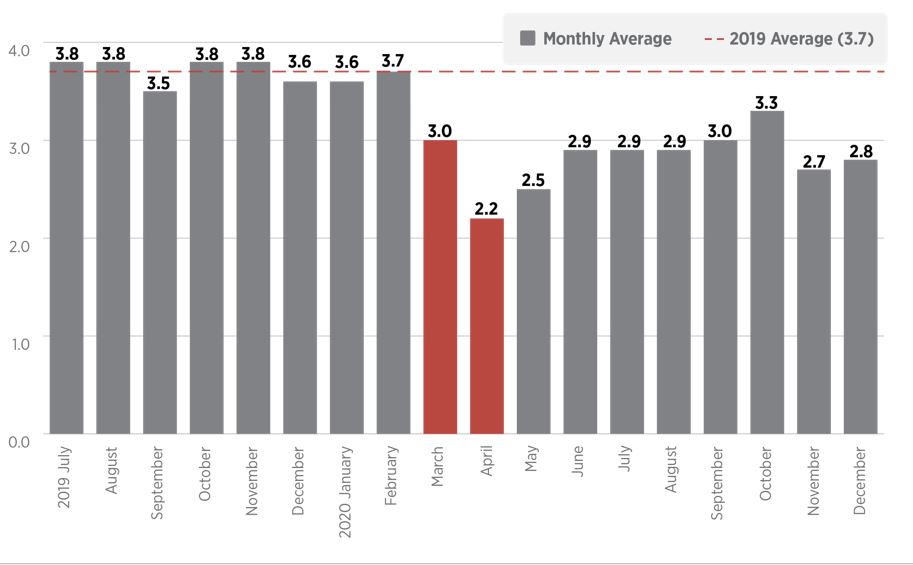
The mean daily number of trips taken by U.S. residents abruptly decreased by approximately 40% in April 2020 relative to the mean daily number of trips in July–December 2019 (before the pandemic), rebounded slightly in May and June, and then leveled off for the remainder of 2020 at roughly 20%–25% below the mean daily number of trips during the second half of 2019 (see Figure).
Methodology
The current study used data from the AAA Foundation’s New American Driving Survey (New ADS), which surveys a representative sample of U.S. residents ages 16 years or older to collect detailed information about all of their travel on the day before they were interviewed. Approximately 5,000 respondents are interviewed each year, with interviews spread approximately evenly over all days of the year. The survey is administered in English and in Spanish, primarily online but also by telephone to accommodate participants without internet access. Data were weighted to account for differential sampling probabilities and to align the demographic characteristics of the respondents with those of the U.S. population. Additional methodological details, a summary of the data, and a copy of the full questionnaire are available in a previous report (AAA Foundation for Traffic Safety, 2021).
The current study examined the mean daily number of trips made by U.S. residents each month among 7,873 respondents who were interviewed between July 1, 2019 (start of data collection for New ADS) and December 31, 2020. The following statistics were tabulated and/or plotted by month to quantify and describe changes in travel in relation to the COVID-19 pandemic.
- The mean daily number of trips taken overall and in relation to demographic characteristics (age, gender, educational attainment, marital status, and urban or rural place of residence).
- The mean daily number of trips made by driving or riding in a personal vehicle; walking or bicycling; and public transportation, taxi, or rideshare.
- The mean daily number of trips made for commuting or work purposes versus for all other purposes, both among the entire population and among workers on days when they worked.
- The mean daily percentage of people who took no trips (i.e., stayed in the same place all day).
- The mean daily number of trips taken by people who took at least one trip (i.e., excluding those who stayed in the same place all day).
Monthly values of these measures during the period of the COVID-19 pandemic (March 2020 through the final month of data) were compared with the average value of the corresponding measures from July–December of 2019.
Results
The current analysis provides additional context with respect to the types of trips and the characteristics of people travelling (and not travelling) as summarized below:
- Early in the pandemic, reductions in travel were greatest among teens and young adults (ages 16–24) and among those ages 65 and older, whereas beyond the initial months of the pandemic, sustained reductions in travel were more uniform across the age spectrum.
- Reductions in travel were much larger among those with higher levels of education, especially early in the pandemic, likely due to this group’s greater opportunity to work from home.
- Reductions in work-related travel were larger than reductions in non-work-related travel, both among the population as a whole and specifically among workers on days when they worked.
- Reduction in daily travel during the pandemic has been more pronounced for modes of transportation that involve shared travel, including public transportation (bus or rail) as well as trips by taxi or rideshare vehicles (e.g., Lyft, Uber, or similar).
- The percentage of the population who stayed in the same place all day fluctuated between 9% and 14% before the pandemic, but increased to 16% in March and 26% in April 2020.
Suggested Citation